-
Recent Posts
Archives
Categories
Meta
Tag Archives: Visualization
Clustering Enriched Ontology Terms
The Metascape forum receives many questions about how enrichment bar graphs and heatmaps are created. This blog post explains the backend algorithms. For a given gene list, we use the accumulative hypergeometric test (or Fisher’s exact test) to compute the … Continue reading
Posted in Manual, Visualization
Tagged Clustering, Enrichment Analysis, Excel, Kappa Statistics, Visualization
Comments Off on Clustering Enriched Ontology Terms
Analysis Report Available Offline
[This is an old blog written on Wednesday, January 31, 2018] A major goal of Metascape is to facilitate communication by presenting bioinformatics analysis results in a way that is easily interpretable to biology users. More specifically, Metascape presents data … Continue reading
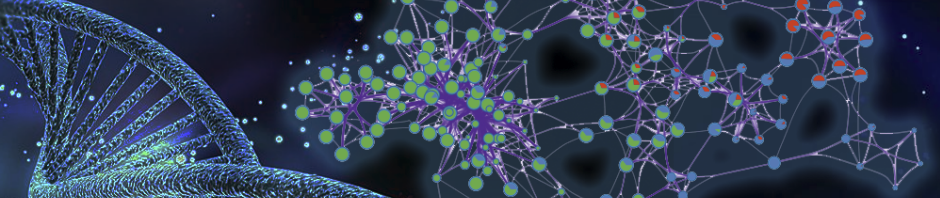
Visualize Networks Online and Offline
Metascape provides intuitive visualizations for either pathway enrichment networks or protein-protein interaction networks. By default, we do not display labels for the nodes within the .png and .pdf outputs, because displaying them will make both networks and labels unreadable (Figure … Continue reading →