Background Gene List for Enrichment Analysis

One frequently-ask question from Metascape users is how to submit a customized background gene list for enrichment analysis. The complete proteome is used as the default background in Metascape, however, this behavior can be overwritten.

_BACKGROUND at Gene List Submission

Metascape can take multiple gene lists as input. For example, in the multi-list Excel upload format, each column contains a gene list. If a gene list is named “_BACKGROUND” (Figure 1), it will be treated as a special content. This works regardless of how many gene lists you intend to analyze (i.e., applicable to a single foreground gene list). Do not worry about whether the foreground genes should be included or excluded in your _BACKGROUND list, as Metascape always append all foreground genes onto the _BACKGROUND list.

Figure 1. Upload background gene list under a special list name “_BACKGROUND”.

Upon file submission, Metascape shows all the foreground gene lists (Figure 2). Notice that although we uploaded 4 gene lists including “_BACKGROUND” (Figure 1), “_BACKGROUND” list is invisible in this view, as Metascape knows it has a special mission.

Figure 2. _BACKGROUND list is used as the background, therefore, not shown after upload.

Submit Background in Custom Analysis

You can also define or overwrite background list during Custom Analysis. Before you trigger the “Enrichment Analysis”, click on “Change” button to define/modify background genes.

Figure 3. Under the Enrichment tab, click “Change” to define/modify background gene list.

In the popup window, paste in background genes in any identifier type supported by Metascape (such as Symbol, RefSeq, Ensembl, etc.), then click “Submit” and then “Close” the dialog. In Figure 4 we only submit 17 test genes as the background for a 121-gene foreground single list. Metascape automatically identifies and appends 119 foreground genes missed from our pasted list, so that final size of the background gene list is 136. (This is just an example, the list of background genes should be much more in real cases). If you want to modify the existing background list, simply update the content in the text area. If you want to use the default whole-proteome as the background list, click on “Remove” and then “Close” to resort to the default behavior.

Figure 4. Example background gene-list definition dialog.

Background Gene List is Ill Defined

Unquestionably background gene list alters the statistical significance (p-values). Background correction becomes critical, when experiments were conducted using a functionally-biased gene collection (such as a kinases siRNA library, a transmembrane CRIPR library, or a bias design due to the constrain of experimental throughput). This induces a technical bias, as all hits identified from a kinase library will be all kinase. We will naturally see enrichments of kinase-related functions, when the whole-proteome is mistakenly used as the background and such enrichments are probably false positives. For instance, Timmons et al. discovered “acetylation” is highly enriched on Affymetrix’s U133 GeneChip (p < \(10^{-51}\)) simply due to its composition [1]. We strongly advise users to provide background list when such custom profiling platform is used.

Thanks to technology advancement, whole-genome and whole-proteome OMICs technologies are in routine use nowadays. Design-related technology bias is less of a concern now, but technology bias remains a challenge. For instance, in RNA-Seq, not all mRNA will be sequenced with equal efficiency and reliability, which is another form of technical bias that is much harder to assess.

Furthermore, the biological system to be studied are biased to begin with. When study a brain sample, many genes are not expressed, therefore, will never had any chance to land on the hit list. Such genes should have been excluded from the background list, however, what genes are expressed in the system often cannot be predetermined. This biological bias has a significant effect and is very hard to taken into account.

To complicated matter further, background gene list is not the only factor affecting p-value calculation. Many subjective factors affecting our definition of the foreground hit list, such as fold change and p-value cutoffs users apply to define differentially expressed hit candidates. The ontology database used for enrichment analysis has intrinsic redundancy, therefore, p-values would need to go through a multi-test correction process. Unfortunately how to carry out such correction remains an open question (see out previous blog on q-value calculation).

Altogether, the accurate determination of enrichment p-values are nearly impossible due to following reasons: (1) true background genes are poorly defined; (2) the list of true foreground genes is subjective; (3) how to perform multi-test correction to p-values remain open. Although Timmons et al. and many bioinformaticians are absolutely right about the need to provide background gene list in enrichment studies, unfortunately it is not an actionable requirement in the majority circumstance.

Final Thoughts

We share similar views as DAVID that in most OMIC studies, although the exact list of background genes affects the magnitudes of p-values, it should only have limited effects on the relative ranking of the enriched terms [2]. We also agree with Timmons et al. that users should avoid interpreting enrichment terms that have only marginal significance around \(10^{-3}\) or \(10^{-4}\), as they might simply become statistically insignificant, if the list of background genes change or a different multi-test correction algorithm is used. Metascape uses \(10^{-2}\) as the default p-value threshold, because a more stringent cutoff might filter out legit enriched terms in studies that are relatively noisier and more difficult to characterize due to their biological nature. We believe the right attitude on the functional enrichment analysis is to treat it as a guidance to filter and rank pathways and processes, but not to religiously believe in the absolute numbers. If the terms of interest have very good p-values (< \(10^{-6}\)) and your system is studied with unbiased OMIC platforms, what background to use and what multi-test correction to apply should not be a concern. Providing enrichment p-values should be sufficient for publication needs, but be prepared to supply q-values, if referees demand more.

Reference

  1. Timmons JA, Szkop KJ, Gallagher IJ. Multiple sources of bias confound functional enrichment analysis of global -omics data. Genome Biol. 2015 16:186.
  2. Huang da W, Sherman BT, Lempicki RA. Systematic and integrative analysis of large gene lists using DAVID bioinformatics resources. Nat Protoc. 2009;4(1):44-57.
Posted in Uncategorized | Tagged , , | Comments Off on Background Gene List for Enrichment Analysis

Visualize Networks Online and Offline

Metascape provides intuitive visualizations for either pathway enrichment networks or protein-protein interaction networks. By default, we do not display labels for the nodes within the .png and .pdf outputs, because displaying them will make both networks and labels unreadable (Figure 1).

Figure 1. Displaying labels tend to make the network visualization unpublishable.

In order to interpret the network, we recommend users to open the network .cys file within Cytoscape application. For those users who do not have Cytoscape installed or just want a quick examination of the networks, Metascape now provides an easy alternative to display networks within the browser.

Visualization within Browser

On the Analysis Report web page. Users can click on the Web icon (Figure 2) to open an interactive browser page. The network is displayed using CytoscapeJS, a simplified Cytoscape web client.

Figure 2. Click on the Web icon to open the network in a new browser window.

In the web view, one can use mouse scroll to zoom in/out. The labels for the nodes can be displayed when they are mouse selected (Figure 3). The application seems to be buggy (at least when the labels have not been displayed yet), if you do not see labels, try to click on the background to unselect nodes first, then mouse select the nodes again.

Figure 3. Select nodes (by mouse boxing them, yellow highlighted) will have their descriptions displayed.

We also included CytoscapeJS application in the Zip package. The AnalysisReport.html file contained with the zip file provides the same Web icon that can lead to the similar web view (works without Internet connection).

Cytoscape AutoAnnotate

Better visualization options are available by opening the .cys session file within the Cytoscape application. AutoAnnotate is a Cytoscape app preinstalled in Cytoscape (if not, upgrade your Cytoscape or use menu Apps > App Manager to install).

To run AutoAnnotate, choose menu Apps > AutoAnnotate > New Annotation Set … (Figure 4).

Figure 4. Launch AutoAnnotate

Configure the Advanced options like the following (Figure 5). This is for the GO enrichment network. There is no need to use AutoAnnotate for protein-protein interaction network, as we display gene symbols for all MCODE networks by default.

Figure 5. Configuration options.

The result is shown below (Figure 6). There are settings (shown on the right panel) to adjust colors and font sizes. Notice that AutoAnnotate nicely extracts keywords for each cluster to provide a functional overview. Since the default effect can be rather crowded, AutoAnnotate is not used by Metascape to produce publishable graphics.

Figure 6. The result of AutoAnnotate.

If you would like move clusters apart for a clearer view, it is important to use menu Layout > Clear All Edge Bends to unbundle edges first.

Figure 7. Unbundle all edges.

Then select nodes and move them to desirable locations:

Figure 8. Separate clusters with edge bundle off.

Then bundle the edges afterwards for a more aesthetic view using menu Layout > Bundle Edges > All Nodes and Edges.

Figure 9. Bundle edges

We turn Figure 9 into Figure 10:

Figure 10. Edge bundle on.

If you would like to publish the final graph, use menu File > Export > Network to Image …

Posted in Comment, Visualization | Tagged , | Leave a comment

Statistics for Enrichment Analysis

Requested by some users, we here provide some technical details regarding gene enrichment metrics found in Metascape analysis results.

First a few constants:

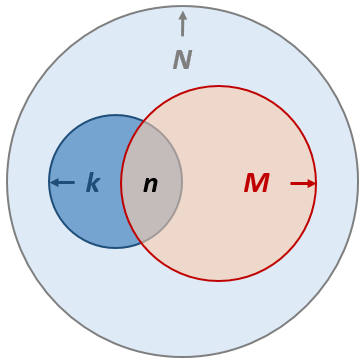
There are \(N\) total number of genes in our study pool (this is also known as the “background” gene list, defaults to all genes in the genome). A given pathway of interest consists of \(k\) gene members. Our input gene list consists of \(M\) genes, among which \(n\) are found to fall into the same given pathway.

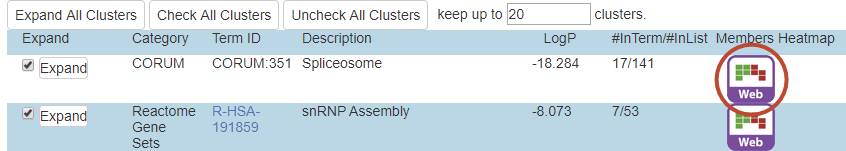
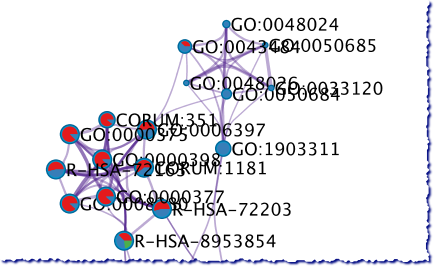
In Metascape output, we use the term “#TotalGeneInLibrary” for \(N\) (big light blue circle), “#GeneInGO” for \(k\) (small dark blue circle), “#GeneInHitList” for \(M\) (big red circle), and “#GeneInGOAndHitList” for \(n\) (the intersection between the dark blue and the red circle).

The background hit rate is \(\frac{k}{N}\) and the hit rate within our gene list is \(\frac{n}{M}\). In Metascape, hit rate \(\lambda\) is denoted as “%InGO”.

Enrichment Factor

\[\frac{\frac{n}{M}}{\frac{k}{N}} = \frac{nN}{kM},\]

indicates how many fold more given pathway members are found in our gene list compared to what would have been expected by chance. This is abbreviated as “Enrichment” in Metascape.

p-value (\( log_{10}P\))

p-value is the most used metric. If the \(M\) input genes were randomly selected from the pool of \(N\) genes, the probability of our obtaining \(n\) genes from the given pathway is :

\[{k \choose n}{ N-k \choose M-n}.\]

hint: first choose \(n\) genes from the pathway of \(k\) members, then choose the remaining \(M-n\) genes from the rest of the gene pool \(N-k\).

The above expression is also known as hypergeometric distribution. The p-value is defined as the probability of obtaining \(n\) or more pathway members, forming a cumulative hypergeometric distribution.

\[ p = \sum_{i=n}^{\min(M,K)} {i \choose n}{ N-k \choose M-i} .\]

p-values are often provided in logarithmic based ten (“LogP” in Metascape). Therefore, a more negative p-value indicates the less chance the observed enrichment is due to randomness. At Metascape, we use the following reference, simply because that is what we have been using in our own publications for years:

Zar, J.H. Biostatistical Analysis 1999 4th edn., NJ Prentice Hall, pp. 523.

q-value

If we are given one particular pathway X and asked “if the gene list is enriched in this particular X?”, the p-value would be the answer. In enrichment analysis, we are typically given Q number of pathways (or gene sets) and asked “what pathways are enriched?”. To answer that, we loop through each one of the Q pathways, repeatedly compute p-values, one per pathway (Q can be 10,000 or more). Thus, even for a randomly selected input gene list, there is still non-trivial chance to find some pathways show good p-values simply due to the large number of the pathways we query against. This is called “multiple-test” problem in statistics.

q-value, therefore, is introduced to address this issue. One way is to simply multiply p by Q:

\[q = pQ.\]

This is called Bonferroni correction. Bonferroni formula over corrects p-value, because not all Q pathways are truly statistically independent. Due to the redundant nature of the ontology knowledgebase, the effective query count Q* is a much smaller value, for which unfortunately there is no good way to estimate.

A popular alternative is called False Discovery Rate (FDR) or BH-adjusted p-value (q-value) as introduced in:

Benjamini Y, Hochberg Y. Controlling the false discovery rate: a practical and powerful approach to multiple testing. 1995. Journal of the Royal Statistical Society, Series B. 57 (1): 289–300.

To calculate the BH-adjustment, all p-values are sorted from small to large first. Given a p-value p at rank i, one would expect pQ pathways to be found with the same or better p-value by chance under the Bonferroni correction. Since we only observe i such pathways, the portion of our observations to be false (i.e., false discovery rate) is:

\[\min(\frac{pQ}{i}, 1).\]

There is some additional math to ensure the resultant q-values are still in the same ascending order, but we will skip the details here. Metascape provides q-values or FDR as “Log(q-value)”.

q-value is closer to the truth conceptually, thus, sometimes reviewers may challenge you to use q-values instead of p-values. However, reviewers may not realize FDR makes use of Bonferroni correction and other assumptions that cannot be validated. For instance, the value Q can be tricky to compute, as knowledgebase is incomplete and not all ontology sources are used during the enrichment analysis. We suspect many enrichment tools may not have implemented BH correction accurately and at the end BH is just another heuristic algorithm. In practice, if the pathways of interest have p-values < \(10^{-6}\), it would remain statistically significant even under Bonferroni correction, let alone BH correction. Only when your conclusion relies on marginal p-values, such as \(10^{-3}\), you should be aware of the multiple test issue. If we view p-value or q-value as a means to rank candidate pathways for downstream validation, the ranking should remain the same.

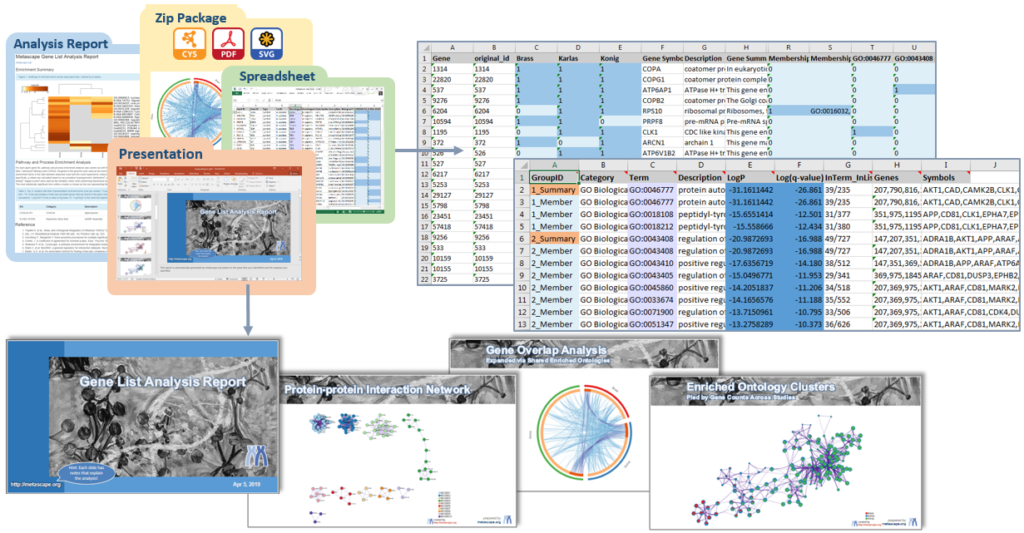
The Excel export from Metascape provides both p-values and q-values; it meets the requirements for prestigious journals such as Cell, Nature, Science, etc.

Z-score

Z-score is correlated with p-value, we provided it within _FINAL_GO.csv file (included in the Zip package), however, non-informaticians could safely ignore this metric.

According to a Wikipedia page, on average we expect to identify \(\frac{Mk}{N}\) pathway members in our input list simply by chance. This count has a standard deviation of:

\[ \sigma = \sqrt{M\frac{k}{N}\frac{N-k}{N}\frac{N-M}{N-1}},\]

The hypergeometric distribution can often be approximated by a bionomial distribution, therefore, we can formulate a Z-score (\(Z\)-standard deviation away from the expected counts):

\[ Z = \frac{(n – \frac{Mk}{N})}{\sigma}.\]

We currently provides Z-score just for the sake of completeness, as it is just an approximate form that serves the same purpose as p-value. If users insist on using Z-score, a possible reference is (simply because this was cited in a Thomson Reuters’ Metabase document, from where we read about Z-score):

Kim SY, Volsky DJ. PAGE: parametric analysis of gene set enrichment. BMC Bioinformatics. 2005 8:6:144.

Similar to the binomial approximate, Metascape estimates the standard deviation of “%InGO” (called “STDV %InGO”) as:

\[ \sqrt{\frac{\lambda (1-\lambda)}{M}} \]

Note

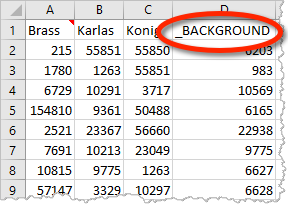
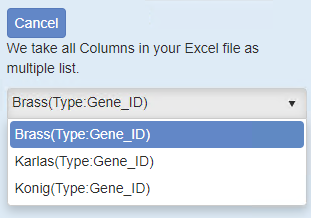
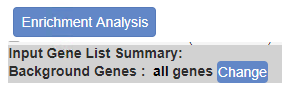
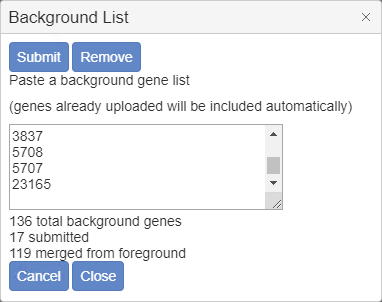
There is a tiny technical details. At Metascape, \(N\) and \(M\) actually refers to the number of genes that have ontology or gene set annotation. Those genes that have no functional annotation are excluded. This, although conceptually more rigorous, should not make a practical difference. \(N\) is default to the whole genome, users can change that by either providing a special gene list called “_BACKGROUND” in the input file, or provide it at the enrichment analysis step during Custom Analysis. If your gene pool is not based on some custom designed gene collections, you can ignore the background gene list, as the true count \(N\) is often unknown.

Posted in Comment | Tagged , | Leave a comment

Metascape is a gene list analysis website designed for biologists

Background

The analysis of genomics and proteomics datasets is not an easy task. Most of the current gene list analysis sites are limited to the enrichment analysis of pathways, thus the value of omics-scale datasets is not fully explored. A more comprehensive analysis is often beyond the reach of biologists without strong bioinformatics support. In the era of big data where large-scale biological datasets has become more readily available, the Metascape website (http://metascape.org) provides a convenient way for biologists to more efficiently and effectively understand experimental data. The Metascape team recently published an article entitled “Metascape provides a biologist-oriented resource for the analysis of systems-level datasets” in Nature Communications (DOI: 10.1038/s41467-019-09234-6).

Introduction

Metascape integrates more than forty bioinformatics knowledgebases; it provides a simple interface to allow biologists carry out a one-click Express Analysis and obtain comprehensive analysis results. It not only includes pathway enrichment analysis, protein interaction network structure analysis, and rich gene annotation functions, but also presents the results in a high-quality graphic language that is easily understandable by biologists. Compared to other tools, Metascape intends to address challenges such as steep learning curves, obsolete databases, and difficulties in result interpretation.

Features

Metascape is very easy to use. Users submit a gene list and click the Express Analysis button. Metascape automatically recognizes all commonly use gene and protein identifiers. After the analysis is complete, the web page will guide the user to open an Analysis Report. The analysis report mimics the format of scientific research papers to present the results of the analysis, and the design of figures and tables is extremely friendly to biologists. The report elaborates on the details of both the analysis methods and the graphics. All graphics come with a high-definition file format that is publication ready. The report also provides a formatted Excel file, which many articles use directly as a supplementary table. The automatically generated PowerPoint file is convenient for scholars to communicate their research. All data and figure files can be downloaded and saved via a Zip file package. The protein network file format also supports further analyses using third-party software such as Cytoscape. Users can also use the Custom Analysis button to adjust more analysis functions and parameters, as they learn more.

Figure 1. Analysis results automatically generated by Metascape.

Figure 2 shows the main analysis results of Metascape using a list of 121 influenza host factors as an example.

Figure 2. a) Metascape removes functionally redundant enrichment paths, showing the most important experimental results straightforwardly with a bargraph. b) Enriched biological pathways can be represented in a network, which facilitates the understanding of relationships among biological pathways or processes; c) Metascape automatically extracts the protein interaction network contained in the input list. d) To make it easier to understand the network, Metascape uses the established MCODE algorithm to find densely-connected protein neighborhoods in the network, and the biological roles of each component are annotated as well.

Modern multi-omics experiments often generate multiple gene lists, and current web tools rarely analyze and integrate multiple gene lists simultaneously. In contrast, this is precisely one of Metascape’s strengths. In fact, Metascape’s “meta” is derived from multi-list meta-analysis. Figure 3 illustrates an example using three independently-published gene sets of influenza host factors.

Figure 3. a) Metascape uses heatmap to make shared and unique biological pathways among the three datasets visible at a glance. b) The enriched pathway can also be presented in a network. Since each set of host factors is represented by a unique color, it is evident that the “viral gene expression” is shared by all three datasets and the “regulation of cell development” is mainly found only in the green corresponding experiment.

Metascape provide biologists with new forms of data representation that are very effective in presenting results. Some papers even use multiple Metascape graphics for the illustration, such as the two examples in Figure 4. Readers may encounter Metascape-style charts from time to time in the literature.

Figure 4. a) Taken from Figure 5 in Lotan et al. Molecular Psychiatry (2018) 78:865; b) taken from Figure 3 in Dong et al. Genome Biol (2018) 19:31.

Comments

Many biologists are still using DAVID for the enrichment pathway analysis. The results of the enrichment pathway analysis are largely dependent on the quality of the backend knowledgebase. DAVID once had not updated its database for six years (2010-2016), and its latest update was two and a half years ago. Independent study has shown that using the two-year old Gene ontology database, users lose an average of 20% of the latest biological insights. Therefore, the importance of regularly updating the database cannot be over emphasized. Unfortunately, the reality is that only 40% of the popular enrichment analysis web tools are reasonably maintained. Readers should question where their current favorite tool falls under. Metascape updates more than 40 backend databases monthly to ensure the most accurate results.

Metascape eliminates the learning curve, because it cannot be easier than a one-click Express Analysis. Nevertheless, Metascape does not trade key functionalities for convenience. Since the authors spent a lot of time carrying out similar bioinformatics analysis during their research over the years, we decided to implement and automate the best practices in Metascape. Since commonly-used gene list analysis tools mostly only provide single-gene-list enrichment analysis, this unfortunately leads to the misunderstanding that gene-list analysis is equivalent to knowledge-driven enrichment analysis. As the result, data-driven protein interaction network analysis is rarely supported by websites. Metascape attempts to rectify that. In fact, in addition to many analysis functions provided by Metascape described above, it also offers powerful features of annotating thousands of genes or using a knowledgebase for membership analysis, all can be extremely helpful in triaging candidates for downstream validation. Please refer to the article or website documentation for details. The analysis capabilities implemented in Metascape is considered difficult even for bioinformaticians.

The Metascape website has been cited by more than 350 times before it was officially published in Nature Communication; the citations include Nature, Science, Cell, etc. Interestingly, about two-thirds of the citations use charts and sheets generated by Metascape. This may be due to the fact that the design of these charts and sheets is based on the many-year experience of the authors research career. We have seen those examples in Figure 4 above.

We encourage biomedical researchers to try Metascape and compare it to the tools you currently use. If Metascape can help you improve your research efficiency in some way, we will be extremely happy. Readers interested in the background of Metascape can read another blog here.

Note: this blog is largely based on Google Translation from an original Chinese version, a very impressive AI product.

Posted in Comment, News, Visualization | Leave a comment

Metascape是专门为生物学者设计的基因列表分析网站

欢迎转载

背景

分析基因或蛋白质组学的数据并非易事一件。目前的基因列表分析网站大多局限于通路的富集分析,并未完全挖掘基因组规模数据集的价值。而更全面的分析对没有生物信息队友的生物学者而言往往是可望不可及。在面对大量基因组数据集的大数据时代,Metascape网站(http://metascape.org)及时为生物学家提供了一种简洁的方式来更有效地理解实验数据。Metascape团队在Nature Communications上发表了题为: “Metascape provides a biologist-oriented resource for the analysis of systems-level datasets” 的文章( DOI: 10.1038/s41467-019-09234-6 )。

介绍

Metascape集成了四十多个生物信息数据库,通过一键快速分析的简洁界面让生物学者能够轻松获得全面的数据解析。 其不仅在内容上包含了生物通路富集分析,蛋白质互作用网络结构分析以及丰富的基因注释功能,而且将结果以生物学家容易理解的高质量的图表语言加以呈现。与其他工具相比,Metascape克服了常见的难以学习使用,数据库缺乏更新,和结果不易理解的缺陷。

功能

Metascape的使用非常简单,只要将基因列表贴入提交,然后点击Express Analysis按钮即可。Metascape能自动识别常用的各种基因或蛋白质的标识符。分析完成后网页会引导用户打开一份分析报告。分析报告模仿科研论文的格式来展现分析结果,图文并茂,对生物学者极其友好。报告中详细阐述了分析方法和图形的意义,而且图形都含可以发表的高清晰文件格式。报告还提供了格式化好的Excel文件,许多文章直接使用它做supplementary table。自动生成的PowerPoint文件方便学者们交流结果。所有的数据和图标文件都可以通过一个Zip文件包下载保存。蛋白质网络文件格式还支持用第三方软件比如Cytoscape进行更加深入的分析。用户熟悉后也可以使用Custom Analysis按钮对更多的分析功能和参数予以调节。

图1. Metascape自动生成的分析结果。

图2以121个流感宿主因子为例,说明了Metascape对单一基因列表的主要分析结果。

图2. a) Metascape去除功能冗余的富集通路,用简单明了的bargraph显示出最主要的实验结果;b)富集生物通路可以以网络方式表现,这更利于理解通路或生物过程之间的关系;c)Metascape自动抽取提交列表中蕴含的蛋白质互作用网络;d)为了更容易理解这一网络,Metascape采用成熟的MCODE算法寻找网络中的密集联结的蛋白质群,并对每个群的生物功能进行注释。

当代的多组学实验往往生成多个基因列表,目前的网络工具很少能同时分析并整合多基因列表,而这恰恰是Metascape的长处之一。其实Metascape的”meta”就是来源于多列表的meta-analysis。图3以三组过去独立发表的流感宿主因子列表为例进行说明。

图3. a) Metascape用heatmap让三组数据集共享的和独特的生物通路一目了然。b)富集通路也可以以网络呈现。由于每一组宿主因子用一个独特的颜色表示,我们可以很清楚的发现Viral gene expression是共享的而Regulation of cell development主要只存在于绿色对应的实验中。

Metascape的图表为生物学者提供了一些对阐述结论非常有效的数据表达形式。有的论文甚至多处采用Metascape的图形,比如图4中的两个例子。 读者在以后阅读文献中可能会不时遇到Metascape风格的图表。

图4. a)摘自Lotan et al. Molecular Psychiatry (2018) 78:865中的Figure 5; b)摘自Dong et al. Genome Biol (2018) 19:31中的Figure 3。

评论

很多学者还在采用DAVID做富集通路分析。富集通路分析结果完全依赖于背后数据库的质量。DAVID曾经有六年的时间(2010-2016)没有维护数据库,最近的更新也已经两年半了。独立研究表明使用两年旧的Gene ontology数据库,用户平均要丢失20%的最新的生物知识。所以定期更新数据库的重要性非同小可。可惜现实是目前大家常使用富集分析工具中仅有40%被正常维护,不知读者目前使用的工具是否属于幸运的一类。Metascape每月更新背后的40多个数据库,以确保提供最准确的结果。

Metascape没有学习使用的壁垒,因为没有比一键Express Analysis更简单了。 虽然好用,Metascape实现的主要功能却是不折不扣。作者由于多年来在自己的科研项目中都要花大量的时间进行这些生物信息分析,所以决定把长期发表文章中体会到的best practices实现在Metascape中。由于常用的基因列表的分析工具仅限于提供单一通路富集分析,这就不幸给研究人员造成了列表分析就是等同于知识驱动的富集分析的误解。而数据驱动的蛋白质互作用网络分析就鲜有网站支持。其实除了以上描述的Metascape提供的林林总总的分析功能之外,其还有非常强大的对上千个基因进行注释或者利用知识库进行成员分析的功能,这些对于后续的基因筛选及其重要,详情请见文章或网站文档。要实现Metascape的这些分析功能对于生物信息人员都是有难度的。

Metascape网站在文章发表之前就已经被350多篇论文引用,其中不乏《自然》,《科学》,《细胞》等杂志。有趣的是约三分之二的引用文章使用了Metascape生成的图表。这可能要归功于这些图表的设计都是基于作者团队多年发表论文的经验之上,所以才有了图4这样的例子。

我们鼓励生物研究者们尝试一下Metascape,再同各自目前使用的工具做个比较。如果Metascape对大家科研效率的提高有所帮助,我们制作网站的初衷就实现了。对Metascape的背景感兴趣的读者,可以阅读另一篇的博客。我们最近特意将博客搬了家,以便中国读者可以访问到。

Posted in Comment, News, Visualization | Leave a comment

The Brief History of Metascape Since 2014

Five years ago (2014), we were looking for a gene-list analysis resource to recommend to biologists in our own research organizations. DAVID stood out in terms of functionality and usability, however, we noticed DAVID did not appear to be maintained. Its databases were over four years old (eventually became six-year old) and questions on user forum were unanswered. More than 10% of genes in our typical submissions were not recognized and thus ignored. See our earlier analysis here.

In the meantime we had delivered a number of high-profile multi-OMICs publications ourselves. Despite each study required specific bioinformatics analyses, especially in terms of calling gene candidates, we nevertheless saw a pattern emerged in the down-stream gene list analysis. Some analysis approaches and visualization styles were found particularly helpful in explaining the biological stories behind datasets. These analyses and visualizations were not easy to program even by seasoned bioinformaticians like ourselves, let alone experimental biologists.

The combination of these two factors led us to start the Metascape journey aiming for providing a resource that would be truly biologist friendly. Many bioinformatics portals have emerged, disappeared, or improved over the past five years, nevertheless, biologist-friendly gene-list analysis web tools remain an unmet need in our opinion (see our survey of 25 gene-list analysis resources). Some most popular tools, such as DAVID, are more than two-year old. Many tools only provide pathway enrichment analysis without the data-driven interactome analysis component. Few tools can consider multiple gene lists and allow cross dataset meta analysis. Therefore, all the motivations for the creation of Metascape remain present even today.

The Metascape team has an interesting composition: bioinformaticians such as Benner’s lab at UCSD developed a popular NGS analysis package called Homer before; Chanda’s lab at SBP generates immense amount of OMICs datasets; Volunteers from GNF have over a decade of individual experience in developing user-friendly tools in a pharmaceutical service environment. This formulation and a year of coordinated efforts led to the beta-release of the Metascape web site, which was announced at a talk at UCSD on Oct 8, 2015 (reported here). As there was no official publication on the Metascape tool itself, we had to use our first Metascape application paper published on Dec 9, 2015 as a place holder for citation purpose.

Metascape user base has been slowly growing through word of mouth and occasionally it was discovered and recommended by social media. With the growing number of published studies using Metascape and its attractive visualizations, new biologists discover this valuable resource every day. After five years of patience and hard work, the Metascape portal itself is now published by Nature Communication on April 3, 2019 (link).

On this special day, we at Metascape are thankful to our user community members for their valuable bug reports, suggestions, and referrals. We also thank NIH NIAID for fundings that has supported the UCSD and SBP labs, as well as the hardware infrastructure enabling this journey. We are looking forward to serving the broader biomedical community by continue to provide a free, fresh, and easy system-level analysis tool for OMICs datasets.

Posted in Comment, News | Leave a comment

Thanksgiving Release

As the Metascape community grows through word-of-mouth recommendations, our responsibility grows as well.  In order to continue to provide a robust and scalable biologist-oriented gene-list analysis service, we have focused on implementing a brand new server architecture in 2018.  Although users may not see much change in the familiar interface, Metascape is now powered by its next-generation engine.  This upgrade allows us to scale up the service as our community continue to expand.  Users should also experience accelerations in data analysis due to more parallel processing components.

We do not stop at improving the site content.  At this release, we introduce two new gene annotation categories: the human phenotype ontology (HPO) and a human gene-disease association data source called DisGeNET.  Users familiar with “Custom Analysis” can now extract phenotype and disease annotations associated with hundreds of gene candidates with one mouse click.  Please see our Gene Annotation feature to learn more.

In addition, we added four new enrichment analysis data sources.  Besides DisGeNET (including HPO), we integrated TRRUST for human and mouse transcriptional regulatory networks, PaGenBase for tissue/cell-specific gene signatures, and Broad’s L1000 gene signatures based on treatments from compounds, shRNAs, cDNAs and ligands.  Please be advised that these new ontology sources are currently only available under “Custom Analysis”.  In addition, due to the enormous size of the L1000 signature sets (53k shRNAs, 250k compounds, 40k cDNAs, and 10k ligands), we recommend using L1000 gene sets in its own, so that it does not eclipse enrichment hits from other categories.

At Metascape, we commit to keep the data fresh, the database contents behind this release is built on Nov 20th, 2018.

On this Thanksgiving holiday, we are thankful for all Metascape users!  We are also thankful for social media workers who found Metascape and helped spread the words!

Posted in News | Tagged | Leave a comment

Welcome to Metascape’s New Blog Space

This will be the new home for Metascape’s blogs.

As Metascape’s user base grows worldwide, it is important for us to reach users in countries where our previous platform was inaccessible.  Old blogs will be all migrated over.

Posted in News | Tagged | Leave a comment

How to Adjust Metascape Network Plots?

[This is an old blog written on Saturday, September 15, 2018]

Metascape relies on Cytoscape [1] to render networks, including both enrichment networks and protein-protein interaction networks.  When a network contains too many edges, it can become a visual “hair ball” and no longer serves as an intuitive depiction.  Such visual clutter can be significantly reduced by an edge bundling algorithm [2] implemented in Cytoscape (Figure 1).

Figure 1.  An example network rendered with straight edges (left) and bundled edges (right).  High-level network edge patterns are more readily visible in the latter case.  Screenshots were taken from a YouTube video here.

To bundle edges in Cytoscape, use menu Layout > Bundle Edges > All Nodes and Edges (Figure 2).  The default parameters work well for most networks.

Figure 2. Operations lead to edge bundling in Cytoscape.

Since edge bundling is so useful, it is used by default in network visualization outputs generated by Metascape.  For example, Figure 3 shows an enrichment network generated based on four input gene lists.

Figure 3. An enrichment network, where each node is colored by its cluster ID.

Sometimes, users would like to rearrange the nodes in the exported network, in order to better illustrate its biological context.  Simply moving the nodes, for instance the red cluster in Figure 3, can result in floppy edges (Figure 4).  We sometimes see unaesthetic network plots due to this limitation, Figure 5 is an example taken from a recent publication.

Figure 4. Simply moving the nodes for the red cluster results in floppy edges circled in red.
Figure 5.  Floppy bundled edges can lead to unreadable networks.  The example is Figure 5.C taken from this PubMed entry.

To adjust Metascape networks, we first need to use the menu option Layout > Clear All Edge Bends.  This will straighten all edges, then you can move the nodes around (the result is in Figure 6, left).  Once you are happy with the new locations of the nodes, simply use Layout > Bundle Edges > All Nodes and Edges to bundle the edges again (right).

Figure 6. Unbundle edges first and them move the red nodes (left).  At the end, bundle edges to produce more visually compact edge patterns for easier interpretation (right).  This final plot is a significant improvement over Figure 4.

To summarize, to change the layout of networks generated by Metascape, we need to unbundle edges and then rebundle them.

Referene

1. http://cytoscape.org

2. http://citeseerx.ist.psu.edu/viewdoc/download?doi=10.1.1.212.7989&rep=rep1&type=pdf

Posted in Comment, Visualization | Tagged , , | Leave a comment

Analysis Report Available Offline

[This is an old blog written on Wednesday, January 31, 2018]

A major goal of Metascape is to facilitate communication by presenting bioinformatics analysis results in a way that is easily interpretable to biology users.  More specifically, Metascape presents data in an article-style web page called Analysis Report (Figure 1).

Figure 1.  Metascape presents analysis results in a PowerPoint presentation, a conditionally-formatted Excel spreadsheet, a Zip package containing all data files and publication-quality graphics.  Most of all, all these files are accessible through an article-like Analysis Report web page

Analysis Report includes details for Results, Materials & Methods, Figures, Tables, and References sections.  Based on feedback, this is an extremely appreciated format for presenting data.  In addition, Analysis Report web page also contains links at the very top of the page to a number of additional files to further facilitate communication:

(1) An Excel file, where tabular data are conditionally-formatted and gene candidates can be easily sorted and filtered based on 1/0 binary columns.  Many publications use the spreadsheet output as journal supplementary files.

(2) A PowerPoint presentation, where slides include key visualizations to help users share findings.  Each slide also contains detailed explanations in the note session, so user can interpret the graphics better and be prepared to answer technical questions from their audience.

(3) All data files and figures are packaged into a Zip file.  Figures include publication-quality formats such as PDF or SVG formats, or formats that can be further manipulated by third-party tools (such as Cytoscape).  So far, 61% of the publications citing Metascape include graphics as figures, making it self-evident that these graphics are indeed interpretable and publication ready.

To protect your data privacy and to also avoid complicated login process, Metascape tags each of your analysis request with a randomly-generated session ID and the Analysis Report can be retrieved by the associated URL for three days.  Although the Zip file can be downloaded and stored locally, the Analysis Report itself are only available online.  After three days, session results are deleted, users would need to reanalyze the data in order to produce the Analysis Report again.

With the latest update (Jan 30, 2018), the Zip package now contains an AnalysisReport.html file as well.  This means users can now download the Zip package, unzip it into a folder, then open to read the AnalysisReport.html file offline in a browser.

In short, Analysis Report can now be stored locally and be shared with others!  We hope you like it.

Posted in News, Visualization | Tagged , , , | Leave a comment